Introduction of OSppc
Prognostic biomarkers can determine the risk of disease relapse and/or progression and further guide the clinical treatments. Proteomic profiling has been shown to be a valuable approach for biomarker discovery in many cancers. The application of protein prognostic biomarker is therefore well placed to complement transcriptomic and genomic profiling in identification of predictive pharmacodynamic and prognostic biomarkers.
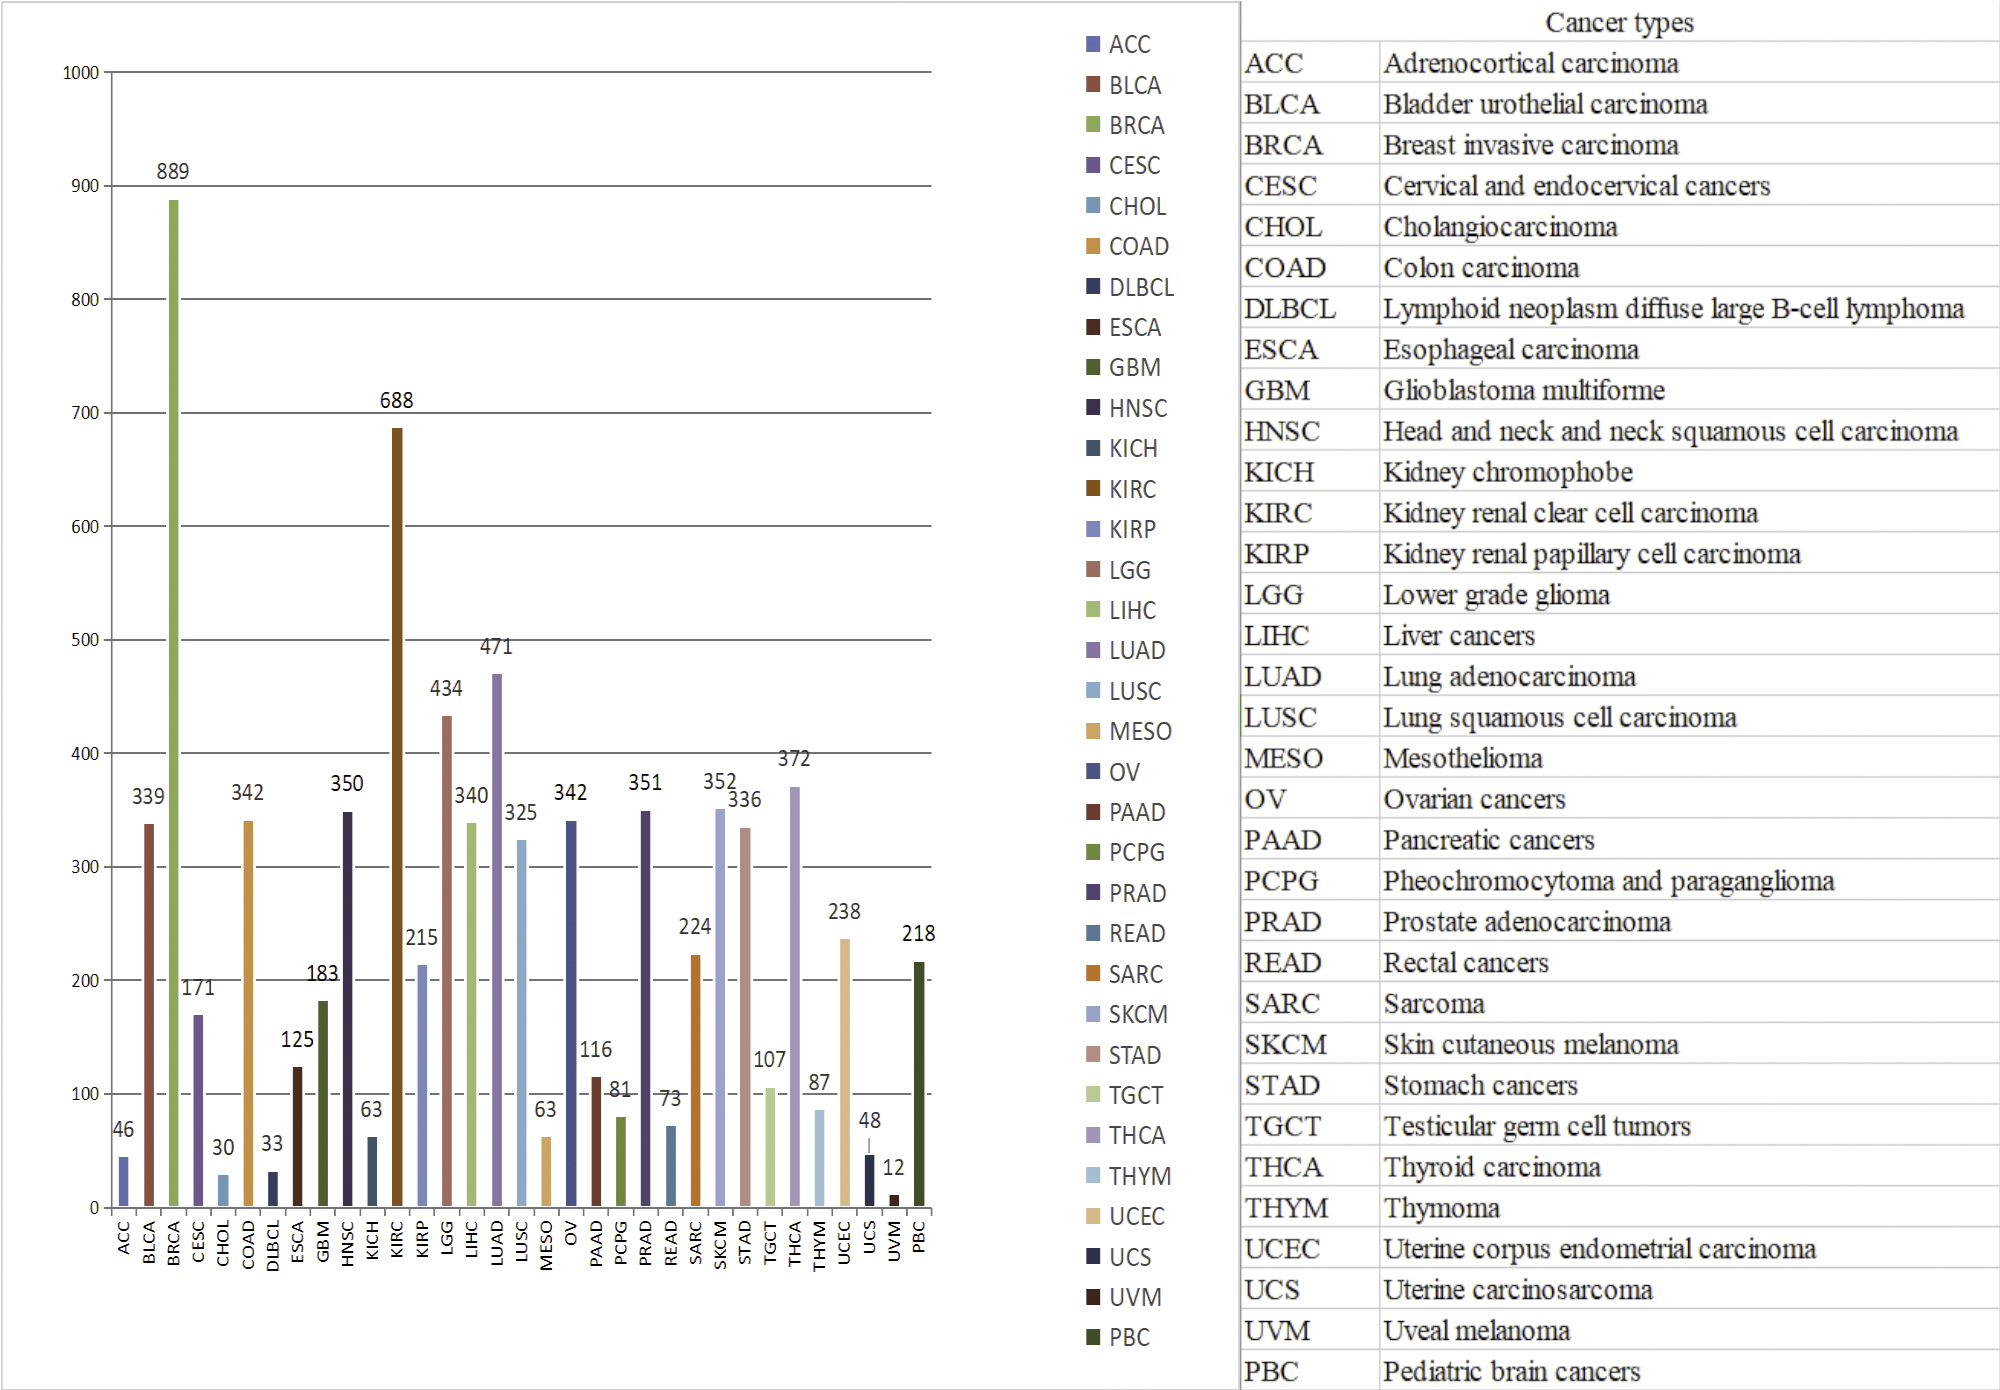
Here, a prognostic analysis web server OSppc based on proteomics data is established. OSppc provides 5 types of survival terms for about 14,000 genes from 8,000 patients of 33 distinct malignancies.
Data and functions contained in OSppc
OSppc includes TCGA (The Cancer Genome Atlas) RPPAs (Reverse-Phase Protein Arrays) data and CPTAC (the National Cancer Institute’s Clinical Proteomic Tumor Analysis Consortium) mass spectrometry data, provides survival analysis, differential expression analysis, and correlation analysis.
The “Home” page describes the data source, establishment process and functional modules.
Annotation of antibody information
The RPPA Core has developed specific annotation of filenames to track antibody information. The naming system is as follows: [Antibody Name]-[Host Species]-[Validation Status]_[Slide Barcode]. The host species and validation status have single-letter codes; the current list for host species includes R (rabbit), M (mouse), G (goat), and T (rat), while validation status includes V (validated), C (use with caution), and E (under evaluation). Additional rules have been placed on antibody names, including no spaces, use of underscore preceding a protein modification, and a single-letter amino acid designation for the modified amino acid. Therefore, for “Akt_pS473-R-V_GBL1234567,” “Akt_pS473” indicates that this antibody recognizes the phosphorylated serine 473 amino acid of Akt, “R” indicates that the host species is rabbit, and “V” indicates that the antibody is valid for RPPA use. Antibody filenames continue to provide quick reference for stained slides (Siwak DR, Li J, Akbani R, Liang H, Lu Y. Analytical Platforms 3: Processing Samples via the RPPA Pipeline to Generate Large-Scale Data for Clinical Studies. Adv Exp Med Biol. 2019,1188:113-147).
Application of OSppc
The first module is “Survival Analysis”. Users can type the gene name into “Gene symbol” dialog box, then select “Data source” (TCGA and CPTAC) and “Survival” terms (OS, RFS, DFI, PFI and DSS), and appropriate cut-off value of protein expression stratification by “Split patients by”. After then click the “Kaplan-Meier plot” button, the output page provides Kaplan–Meier (KM) survival curves, Hazard ratio (HR) and 95% confidence interval (95%CI) of protein and its corresponding mRNA.
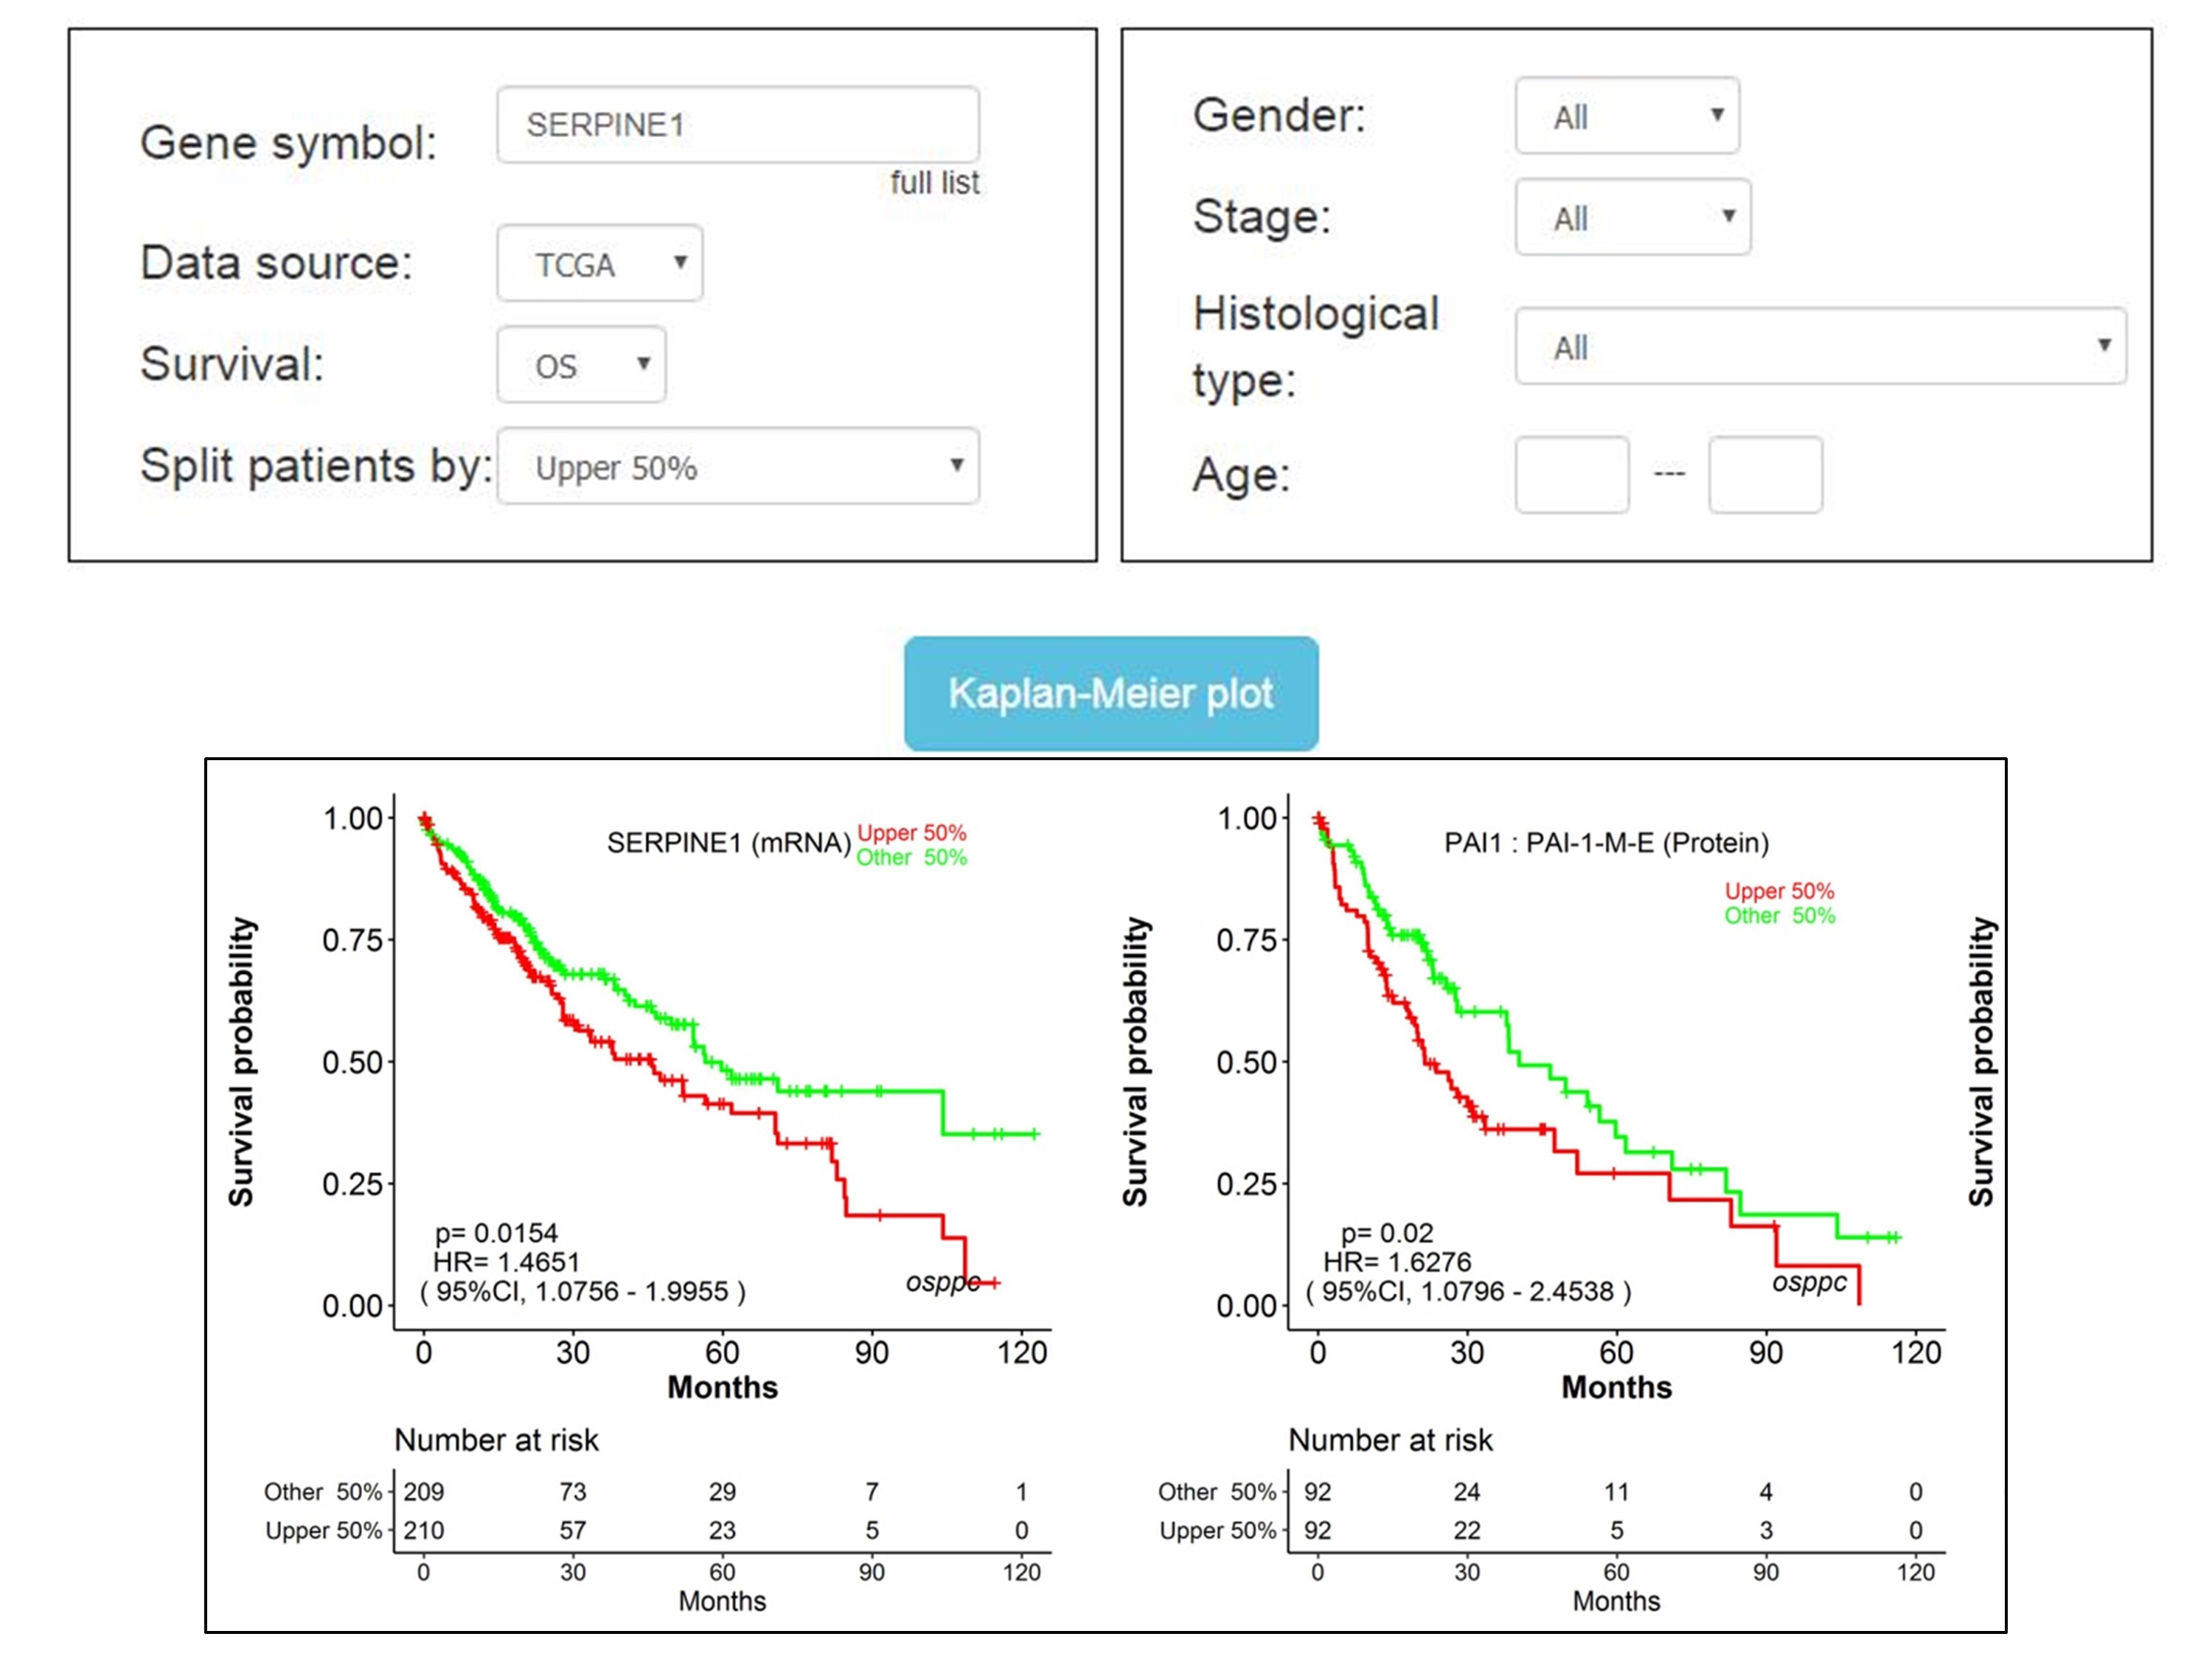
Note: some genes and their encoded proteins have multiple aliases, but they represent the same gene or protein.
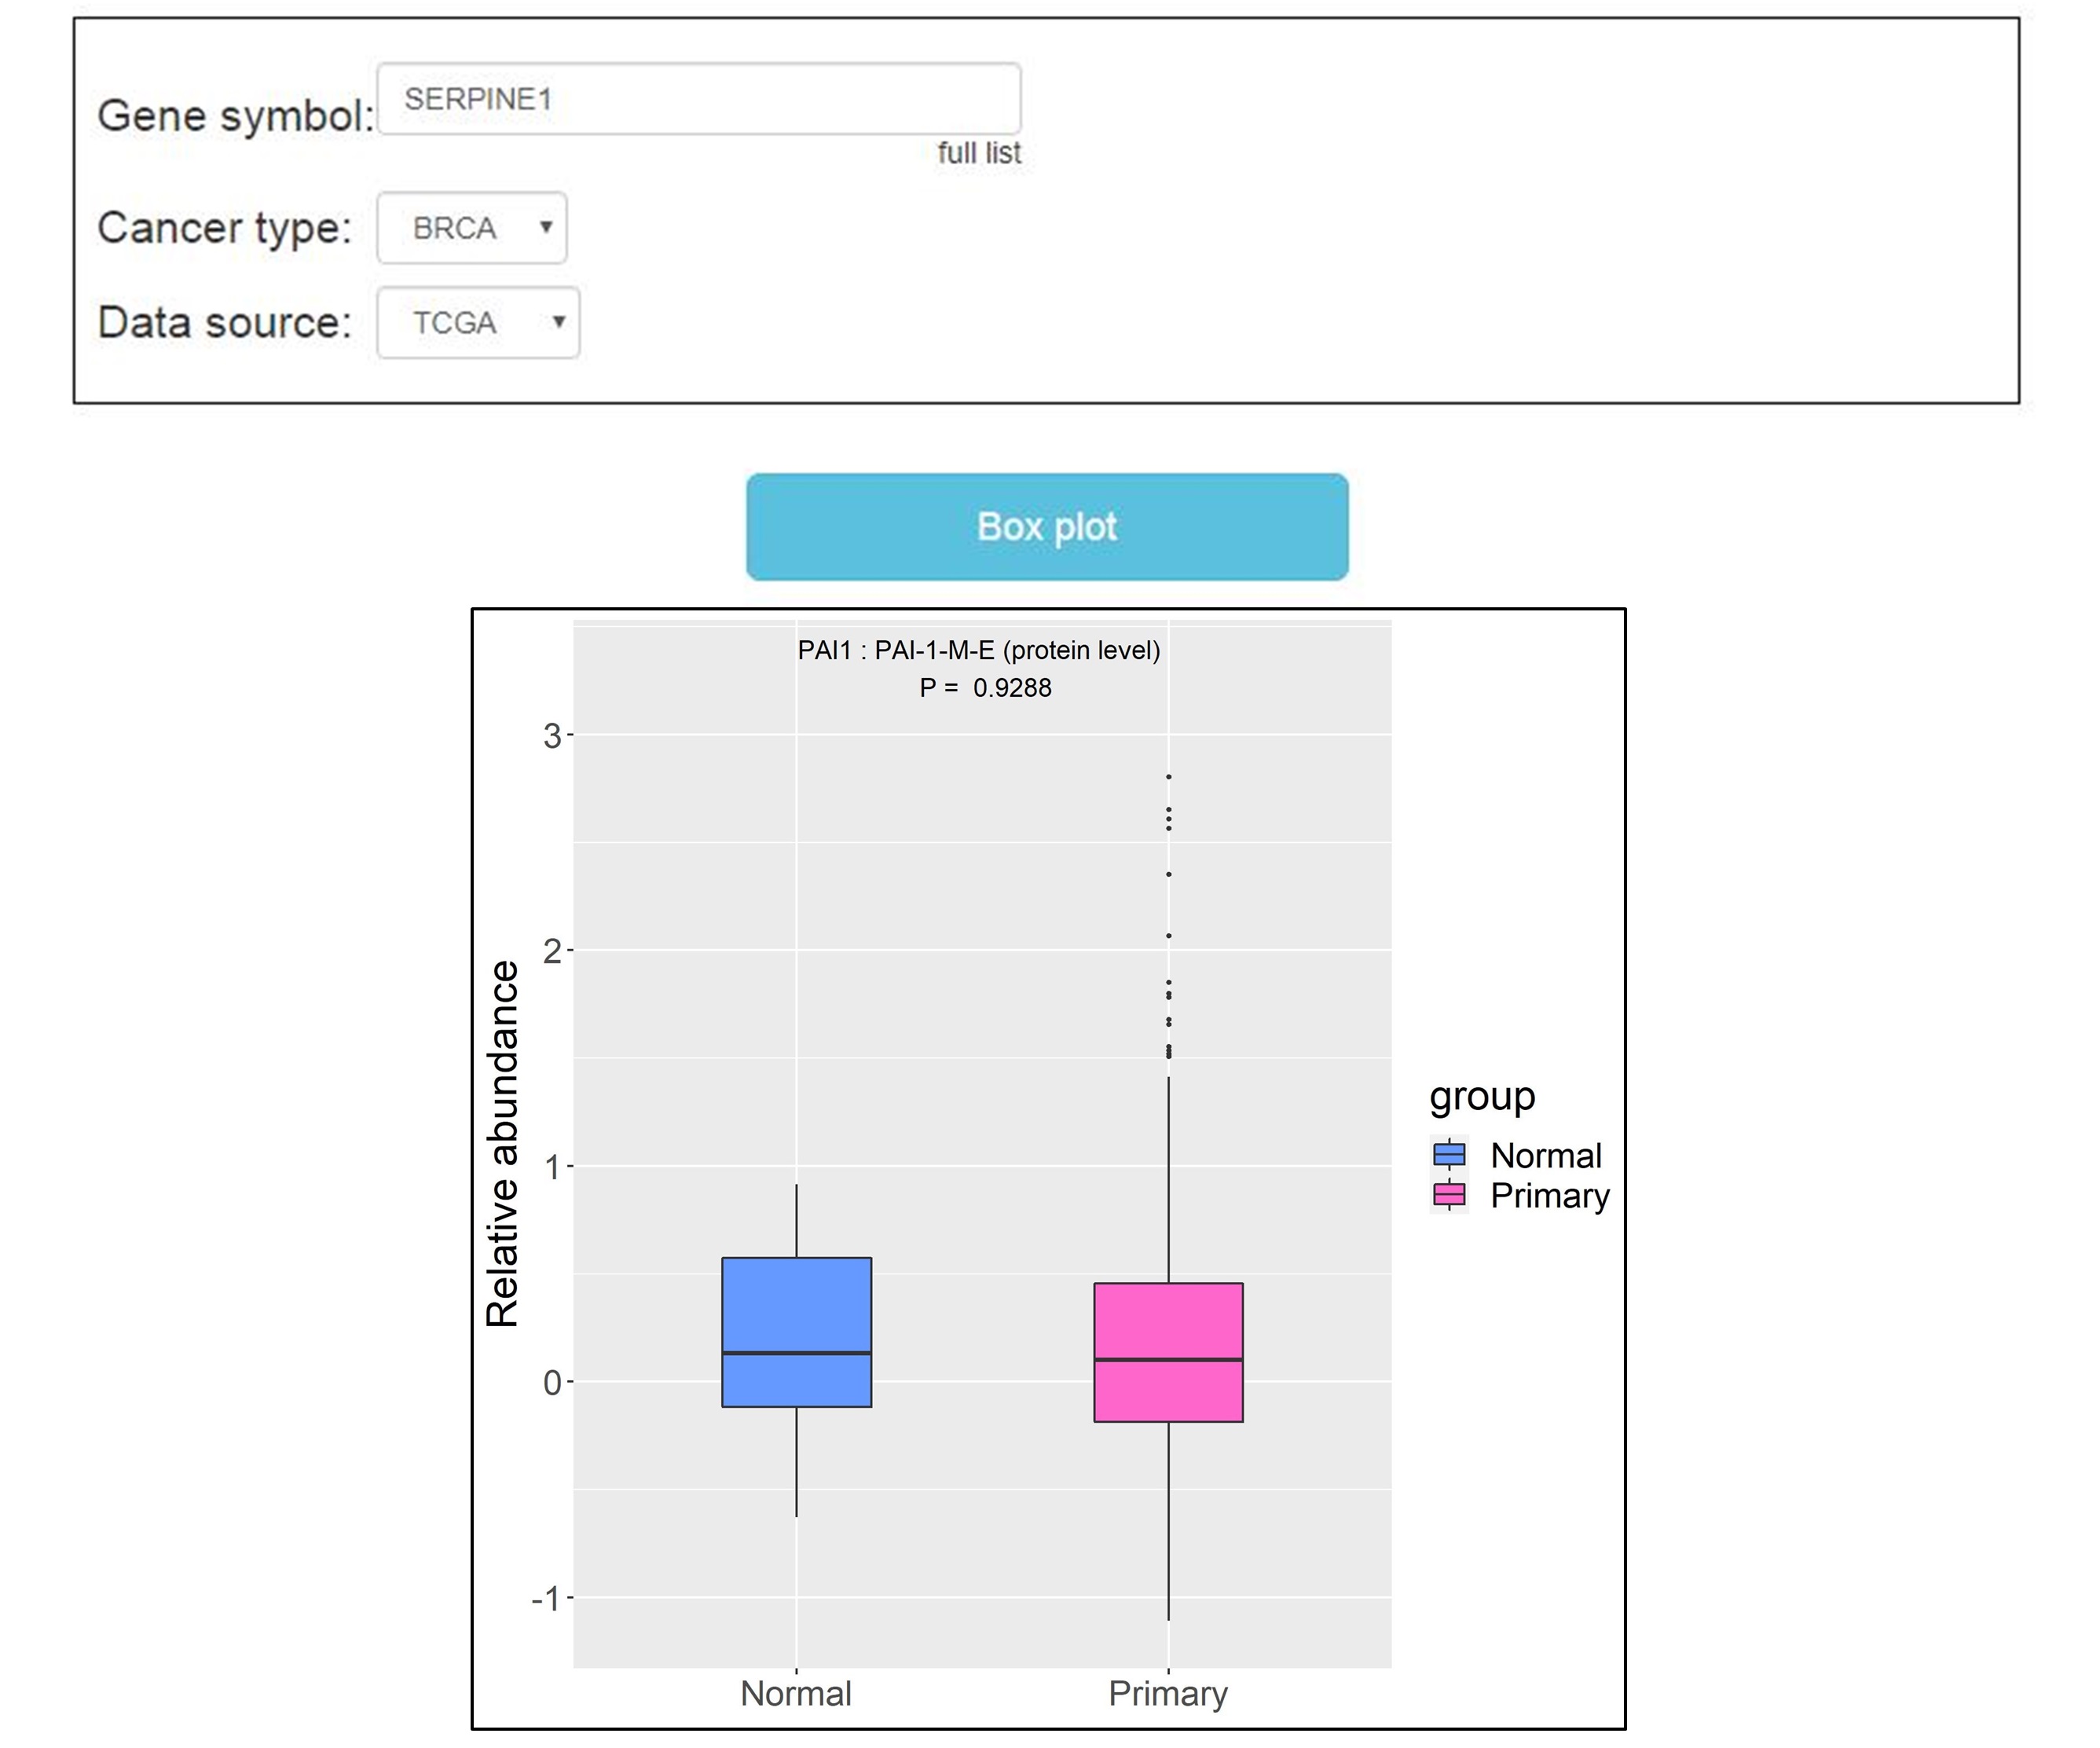
The second module is “Differential Analysis”. Users can type the gene name into “Gene symbol” dialog box, and select “Data source” (TCGA and CPTAC). Then click the “Box plot” button, the output page provides statistical analysis of protein differential expression by Mann-Whitney Wilcoxon tests, including the comparison of primary cancer and adjacent normal tissues, primary cancer and metastatic cancer, primary cancer and recurrent cancer.
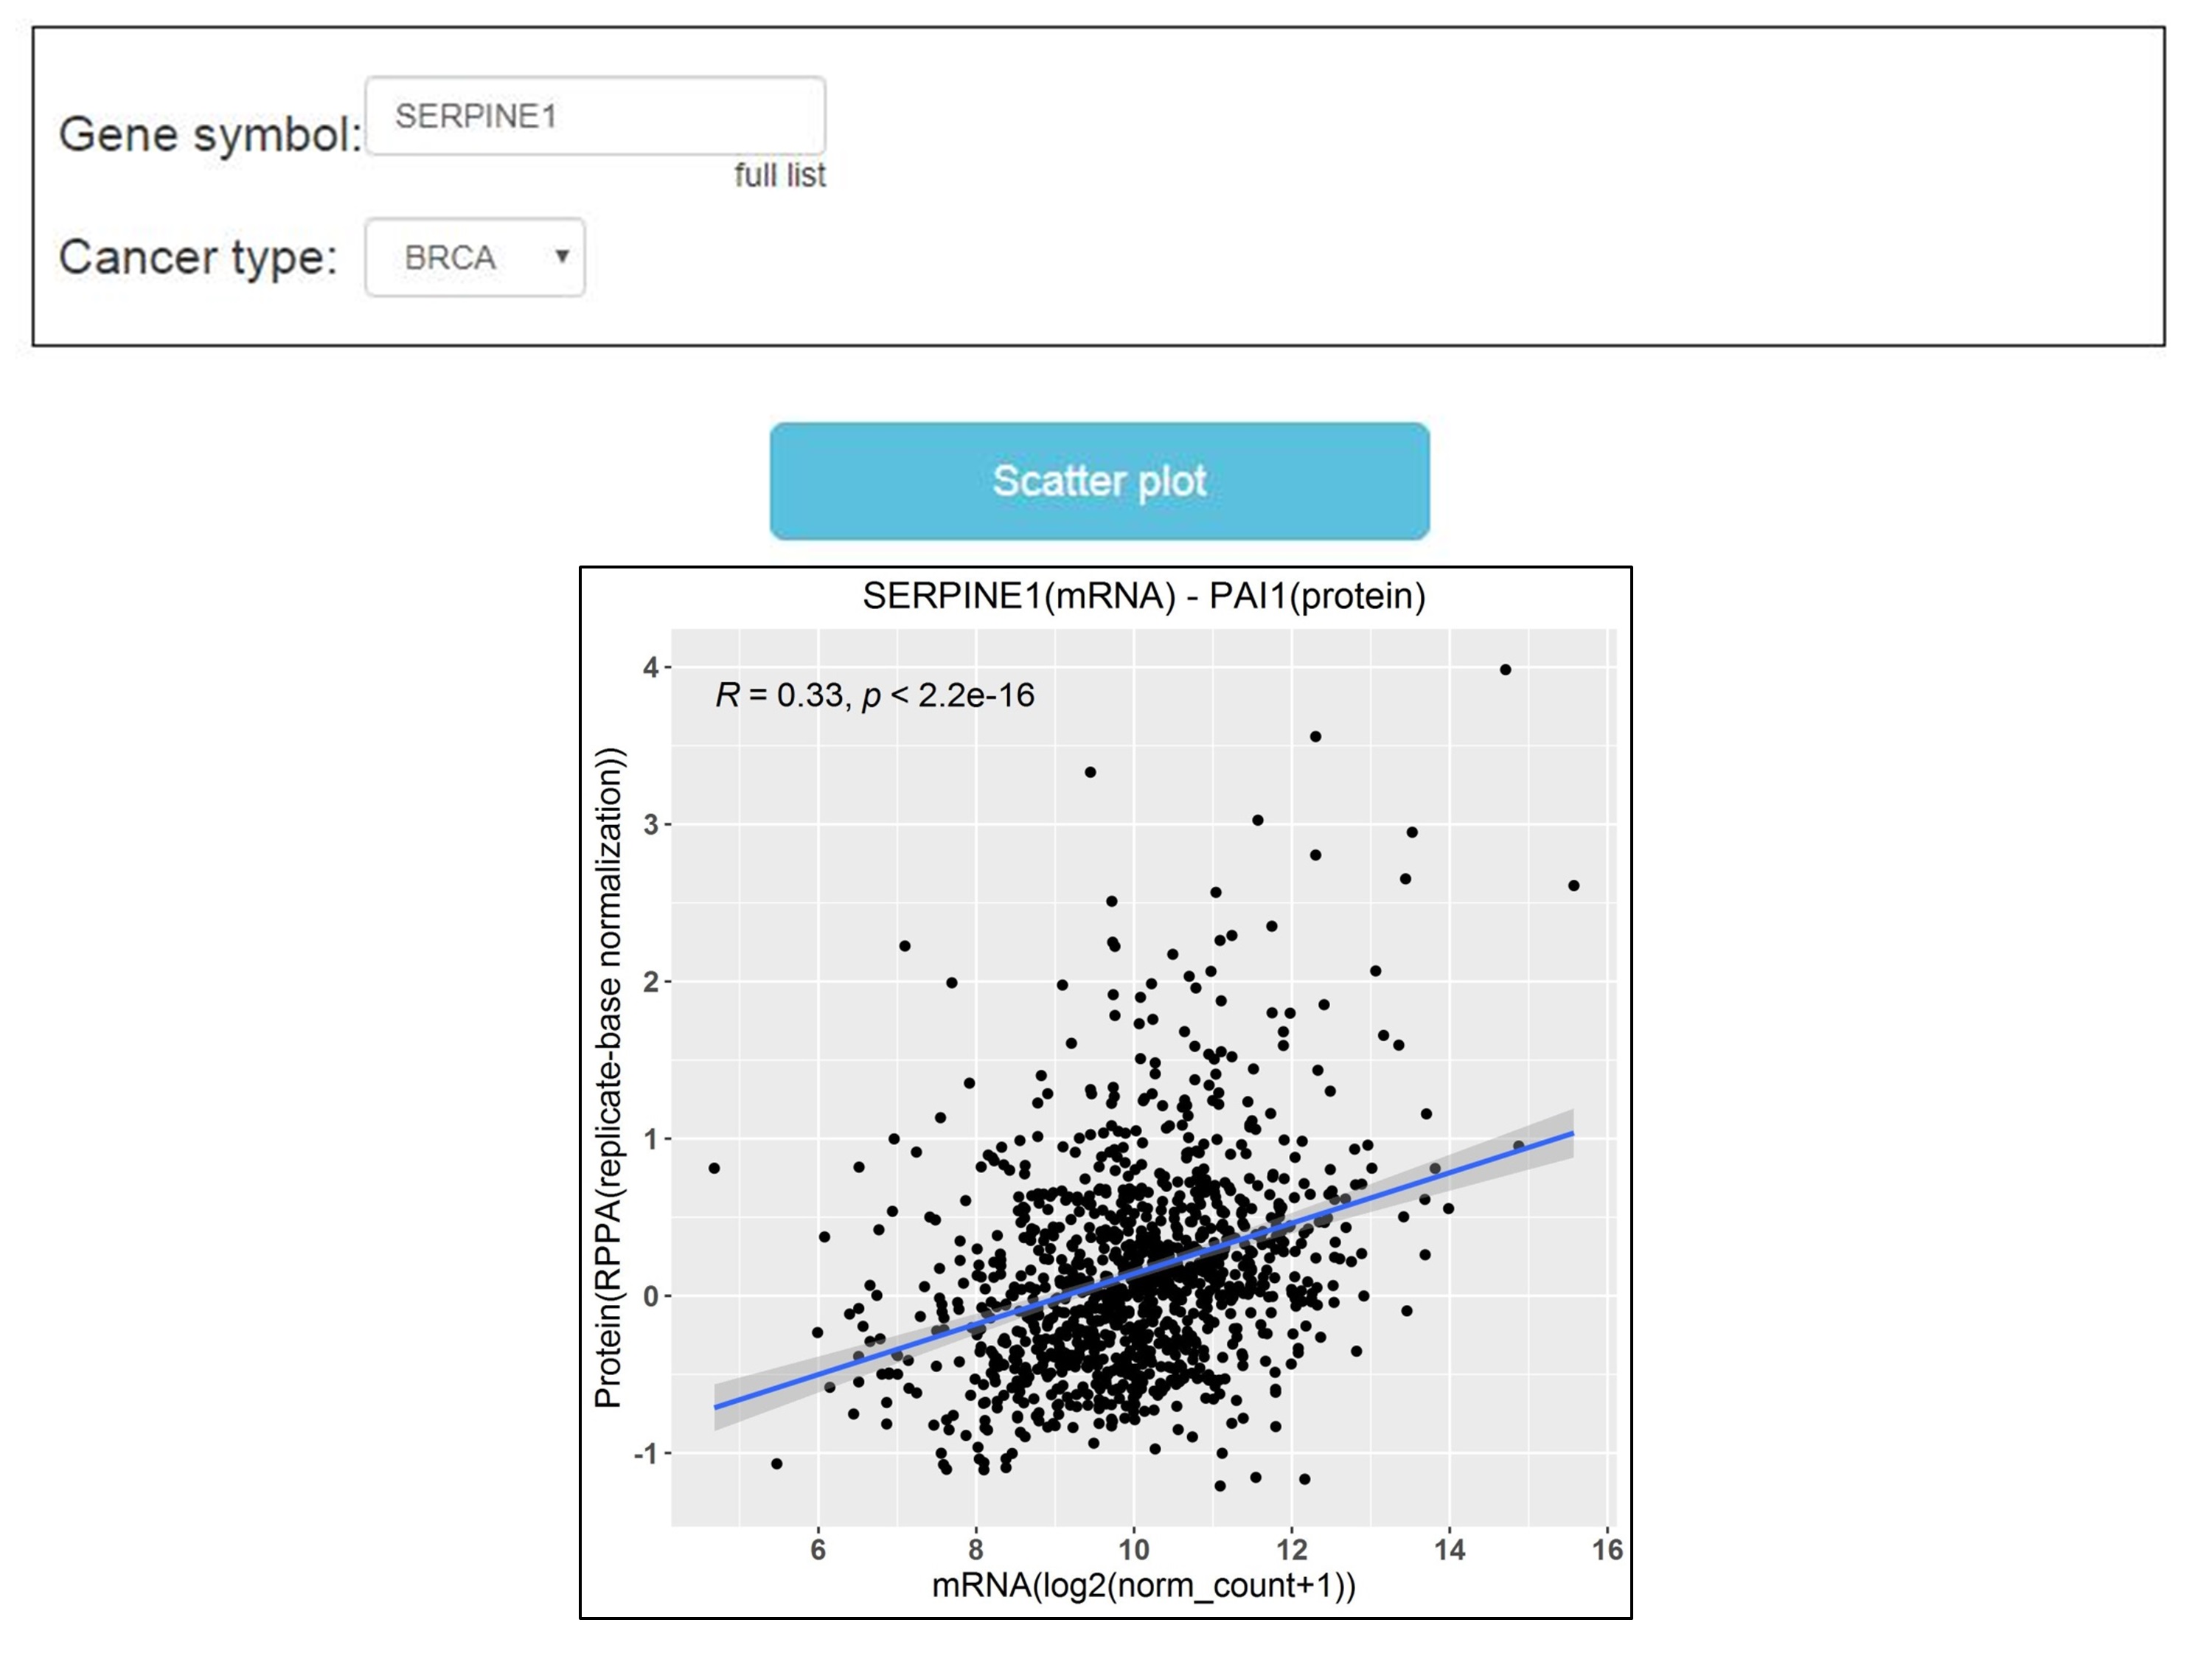
The third module is “Correlation Analysis”. Users can type the gene name into “Gene symbol” dialog box and click the “Scatter plot” button, the output page provides the correlation analysis of protein and its corresponding mRNA by Pearson′s correlation coefficient. However, the data of this module only comes from TCGA.
Results download
The JPG download is available by clicking the button nearby the results.